Beyond build size: timings, dependencies, and vulnerability scanning

When we shipped Bugsee Build Size Analysis a couple of weeks ago, the argument was — in hindsight — obvious: every Release build leaves a useful fingerprint, and the dashboard you already use for crashes is the right place to keep it. Today we’re extending that fingerprint in three directions teams have been asking for: per-task build timings with regression detection, full dependency graph tracking, and a vulnerability scanner that runs against the resolved graph on every build.
These features are rolling out on Android first through the 4.x Gradle plugin (currently in beta), with the dependency-capture side landing in iOS’s BugseeAgent shortly afterwards. None of them require any code changes inside your app — whatever your build pipeline already runs is enough.
Build timings, now with diffs
We’ve been collecting per-category build timings — managed code, native, resources, packaging — since the day Build Size Analysis shipped. What was missing was the obvious next step: comparing them against the previous Release build of the same lineup so a slow PR shows up as “this build took 96 seconds longer than the last one, and most of the regression is in one specific task”.
That comparison now exists. On every Release build we look up the baseline — the most recent prior Release of the same package, format, and configuration — compute per-task wall-clock deltas, and surface the headline number with the regressed and improved tasks bucketed underneath it. Tasks that are entirely new on this build (a Gradle step the team just introduced) and tasks that have disappeared show up as their own buckets. If the diff isn’t meaningful — the build configuration changed between the two builds in a way that makes per-task comparison apples-to-oranges — the dashboard says so explicitly rather than handing you a pretty-but-misleading delta. Per-task timings are an Android Gradle plugin feature today; we’ll bring the same shape to iOS once the data path lands.
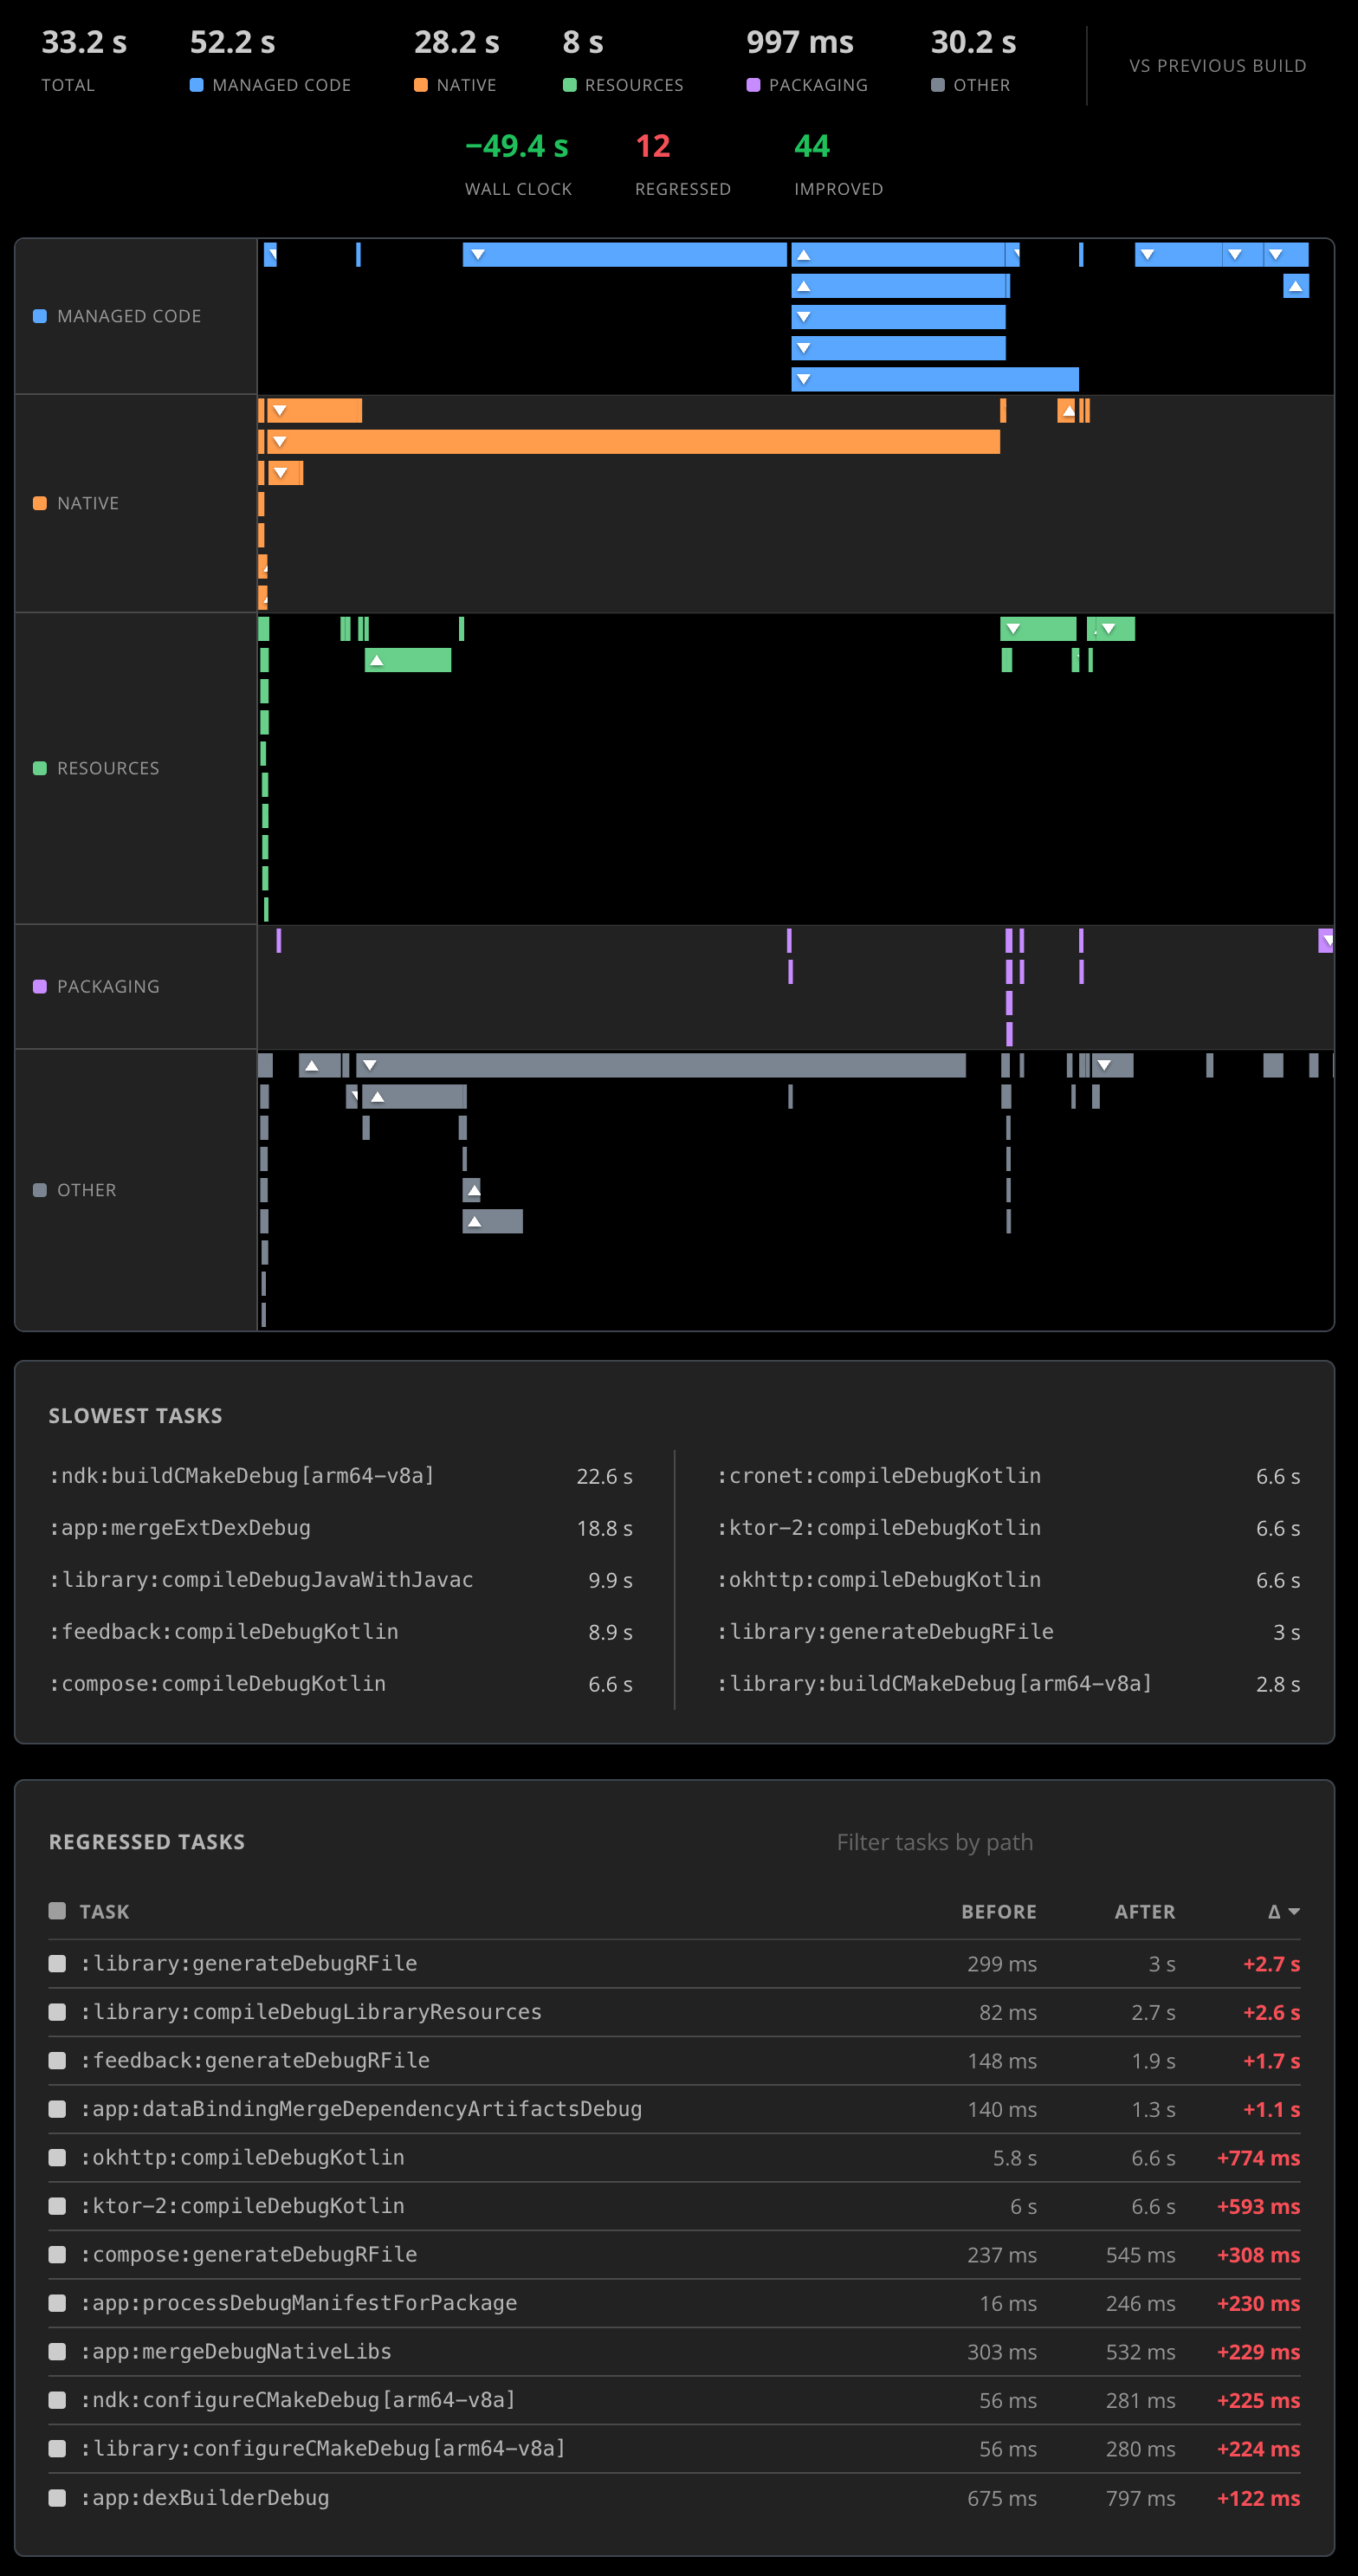
This is the lightest of the three additions and the most self-explanatory: faster builds are better, regressions are bad, and we want you to see them at PR-review time instead of three release branches later when CI is mysteriously taking eleven minutes longer than it used to.
Dependencies as a first-class signal
Most teams have a vague mental model of their dependency graph and an outdated one in their head. The graph changes constantly — every Renovate / Dependabot PR, every transitive bump, every new feature that pulls in a vendor SDK that pulls in its own dependencies. The blast radius of any of those changes is invisible until something breaks.
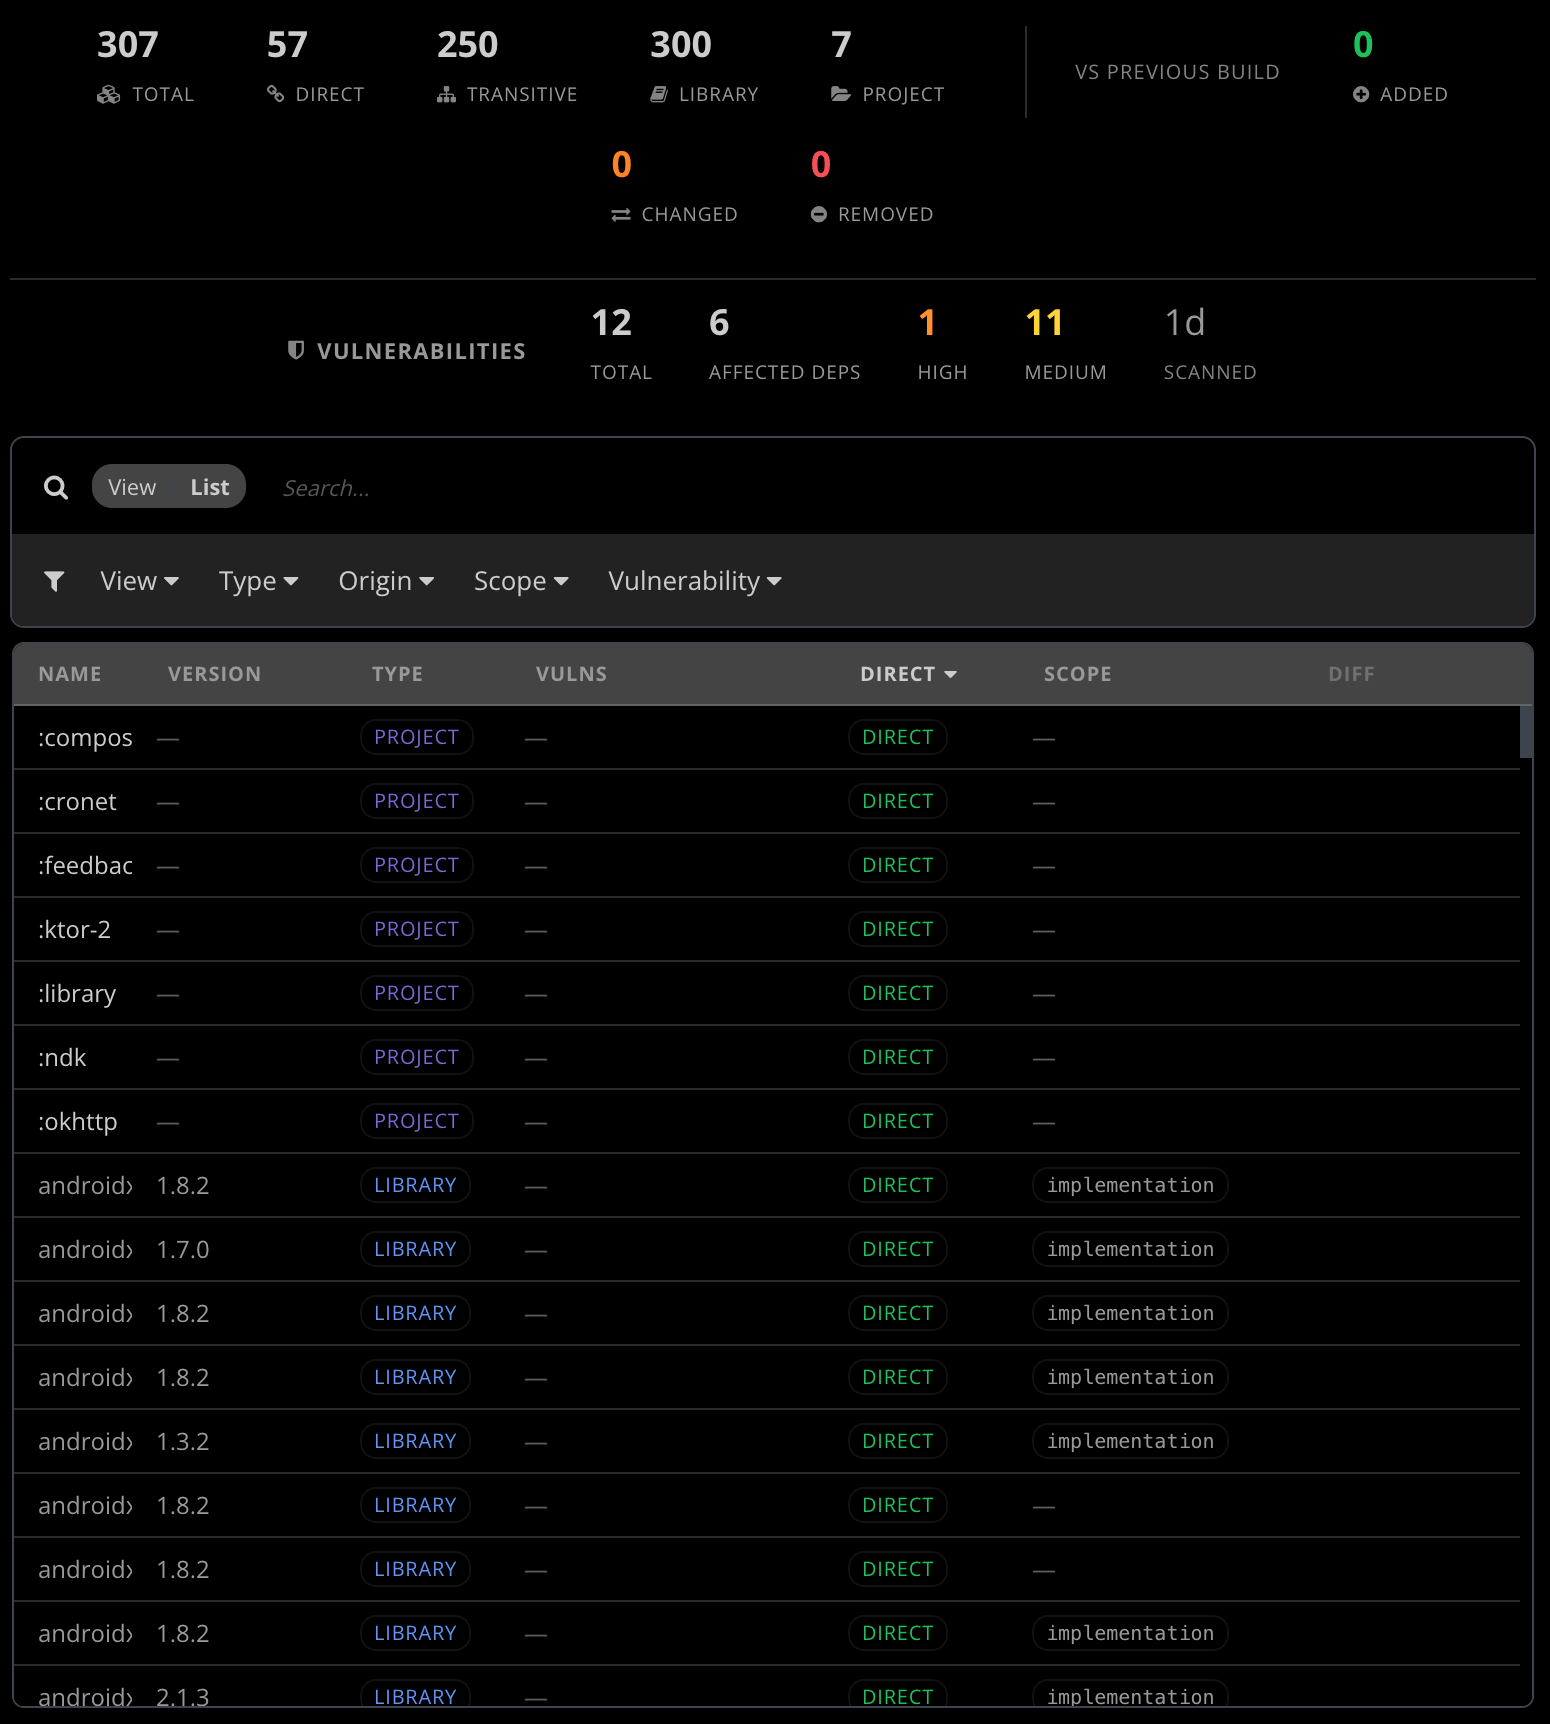
Starting with this release, Bugsee captures the full resolved dependency graph for every Release build on Android and iOS. Resolved is the load-bearing word: not what your build.gradle or Package.swift declares, but what the build system actually chose to ship — every transitive dependency, every version pin, every Maven coordinate, every CocoaPods spec, every Swift Package, every Carthage entry, traced down to the leaves.
We then do the obvious thing: diff against the baseline. For every Release build the dashboard surfaces four buckets:
- Added — dependencies present on this build that weren’t on the previous one. Often the most interesting bucket: a transitive addition you didn’t directly request, a switch from one networking stack to another, a new vendor SDK someone slipped into a feature branch.
- Removed — dependencies that disappeared. Sometimes intentional (you finally migrated off Library X), sometimes a warning sign (an artifact got accidentally excluded by a packaging change).
- Changed — same dependency, different version. The largest bucket in steady-state, and the one that most often correlates with the “our app started crashing after we updated Y” reports that show up in support a week later.
- Unchanged — for completeness; the rest of the graph that didn’t move.
One detail worth calling out: we don’t pretend the diff is meaningful when it isn’t. If the previous build collected its dependency graph under different terms — a different build configuration, a different collection scope, or one side that hit the producer’s entry-count cap — we mark the comparison as incompatible, give you the mismatch reason, and leave the headline counts at zero. The alternative is dressing up garbage as a finding, which we’ve seen other tools do and don’t want to inherit.
Vulnerability scanning, on every build
Once we know the full resolved dependency graph, scanning it for known vulnerabilities is the next obvious step — and not doing it would be careless.
Automatic, on every Release
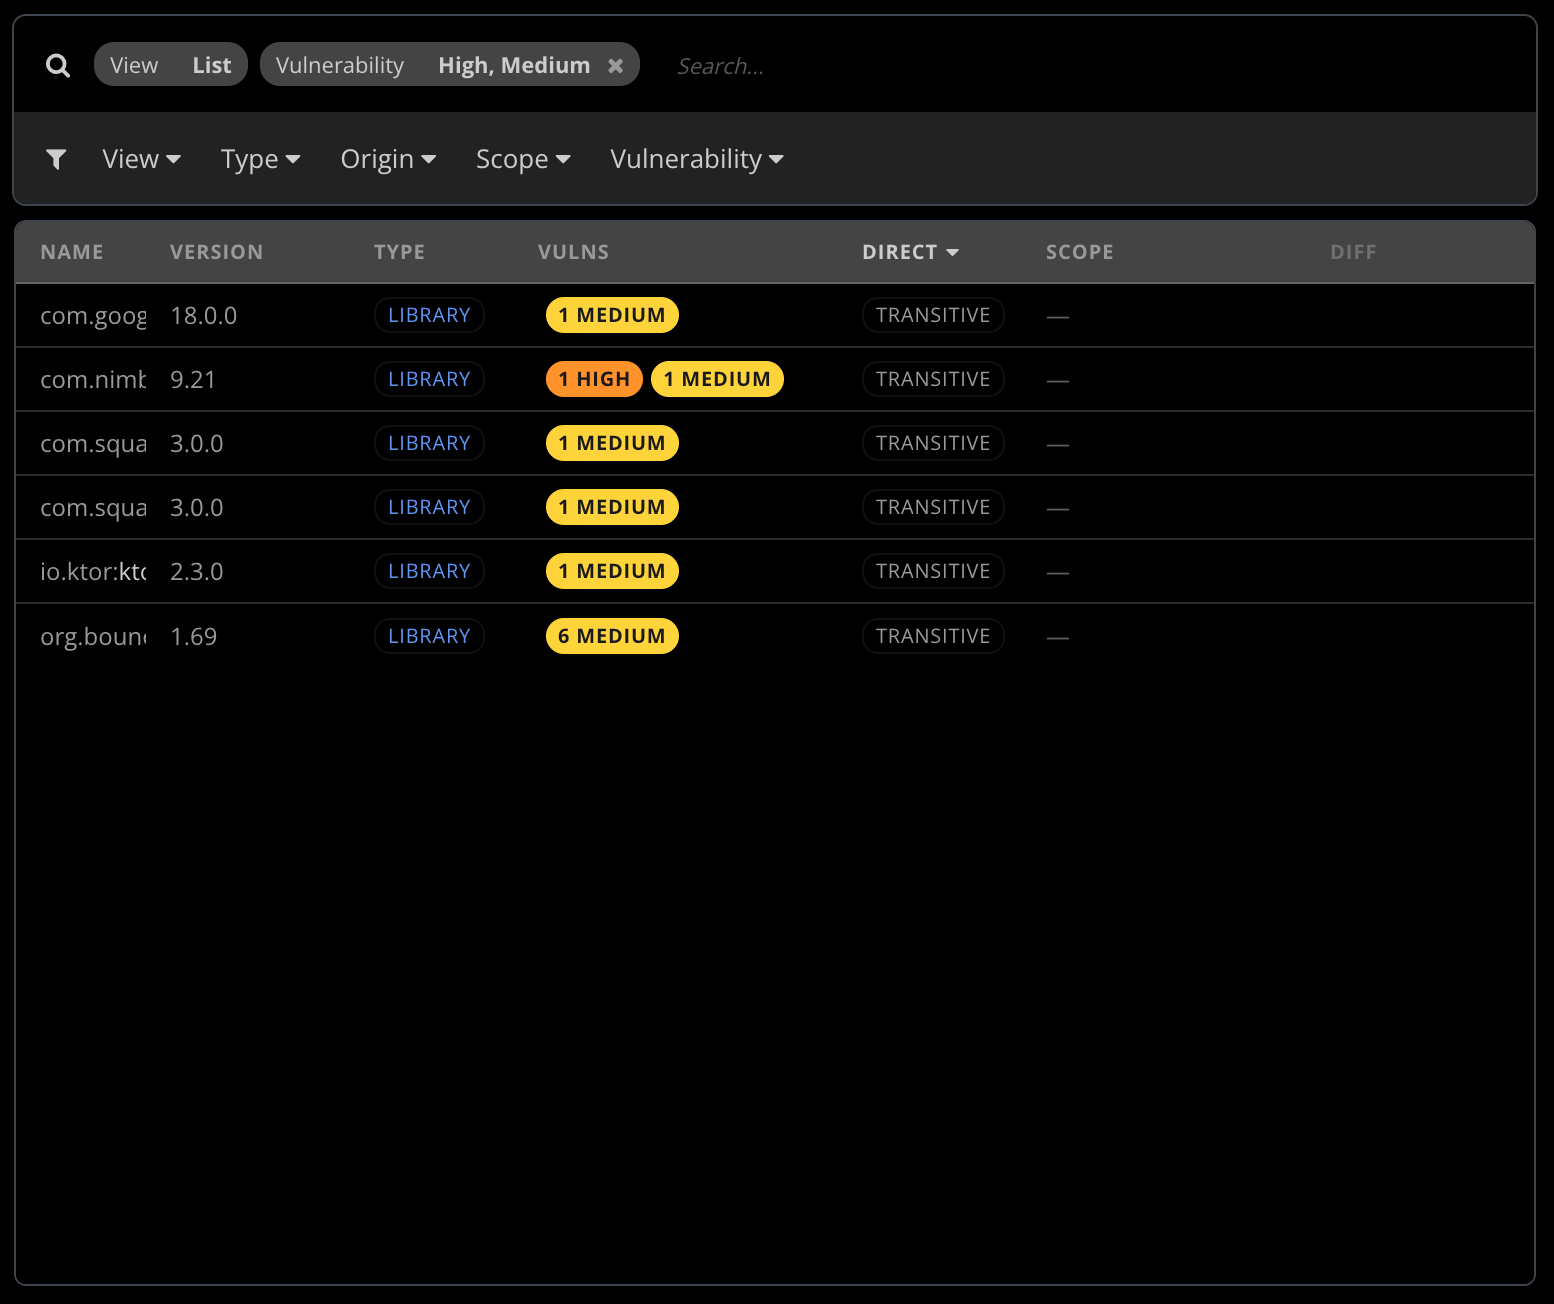
As soon as the dependency graph is processed, the server kicks off a scan against two public sources: the OSV database (the open-source vulnerability index) and the GitHub Advisory Database, looking up every dependency at its specific resolved version. No additional configuration; the scan runs whenever you have a Release build with dependency collection enabled.
The scan settles into a structured summary: severity bucket counts (critical, high, medium, low, info), the total number of advisories across the graph, and the number of distinct dependencies that carry at least one advisory. The same dependency can carry several advisories — an unmaintained networking library may rack up half a dozen CVEs over the years — so we surface both numbers separately. The “twelve advisories spread across four dependencies” framing matches how teams actually triage: fixing one library often closes the whole stack of advisories it carried, and you want to distinguish “many advisories on few libraries” from “few advisories on many libraries”. They have very different remediation costs.
Scheduled re-scanning catches builds you’ve already shipped
The scan that ran the day a build went out is the first scan, not the only one. Vulnerability databases move — a library that was clean at release time can become vulnerable months later as new CVEs are published against versions you’re still shipping. The server runs a periodic sweep over the set of builds with successful prior scans, picks the ones that haven’t been re-checked recently, and queues them through the same scanner. No user action, no CI step, no separate cron job to maintain on your side.
The practical consequence is the one that actually matters: if a build that’s already in production becomes newly vulnerable because a fresh CVE was published against one of its libraries, the team finds out without anyone having to remember to re-check. The same notification rails described below fire on a sweep just like they fire on a fresh release scan — an email and a webhook for every build whose advisory profile crossed into “new findings” territory since the last scan.
The diff that actually matters
The single most useful question a developer can ask about a vulnerability report is not “how many critical advisories does my app have today?”. That number is steady-state and largely a measure of the maintenance debt the codebase has accumulated. The question that drives action is “what changed in this build vs the previous scan of the same build?”.
For every build that has been scanned at least once with a baseline scan available, the dashboard surfaces:
- New — advisories present in this scan that weren’t in the previous one. Either a dependency moved to a vulnerable version, a new vulnerable dependency was added, or a fresh CVE was published against a library that’s been in the graph all along. All three are useful to know about; all three would be invisible without the diff.
- Resolved — advisories that were in the previous scan and are gone now. Mostly the result of dependency upgrades or removals; sometimes the result of a CVE being withdrawn upstream.
- Unchanged — advisories carried over. Useful as context (how much of the existing backlog this build inherits) and as a measure of how much of your “critical advisory” count is genuinely new vs accumulated.
Once you have the diff, the question of “should I block this release?” stops being “is the total over a threshold?” (which biases against old, well-known projects with long-accumulated advisory counts) and starts being “does this release introduce critical advisories that weren’t there before?”. The second question has an answer that’s actionable on PR review.
Re-scanning on demand
Vulnerability databases move. A scan that was clean yesterday will not be clean forever — new CVEs are published every week, and the right reflex when a serious advisory lands in your dependency tree is to re-check every build that’s currently in production, not just the next one you cut. The dashboard supports on-demand re-scanning against the current state of OSV and the GitHub Advisory Database. The same trigger is available through Bugsee’s Model Context Protocol server, which means an AI agent — Claude, Cursor, Copilot, anything else with MCP support — can re-trigger a scan as part of a security review workflow without anyone touching the dashboard.
Re-scans are rate-limited at the per-build level so a chatty integration can’t hammer the worker. Any single build can be manually re-scanned at most once every three hours after a successful scan, or once an hour after a failed one. That’s tight enough to block runaway automation but loose enough that an automation walking through many builds back to back never bumps into the limit in practice.
How you find out
If a Release scan completes and the diff against the previous scan shows new advisories, the dashboard fires the existing notification rails:
- Email goes to users in the organization who’ve opted in to per-application vulnerability notifications (the preference is off by default, on a per-application basis). The body carries the headline diff (new / resolved / unchanged advisory counts), the top affected dependencies with their severities and short summaries, and a deep link to the build page for the full report.
- Webhooks fire a vulnerabilities-detected event to every subscribed endpoint for the organization, scoped to the affected application. The same Slack and Microsoft Teams notification rails you already wire up for crashes deliver this one too; any other integration you have set up against webhooks (Jira-issue creation, custom HTTP endpoints, whatever) picks the event up automatically — no additional setup, no separate channel to configure.
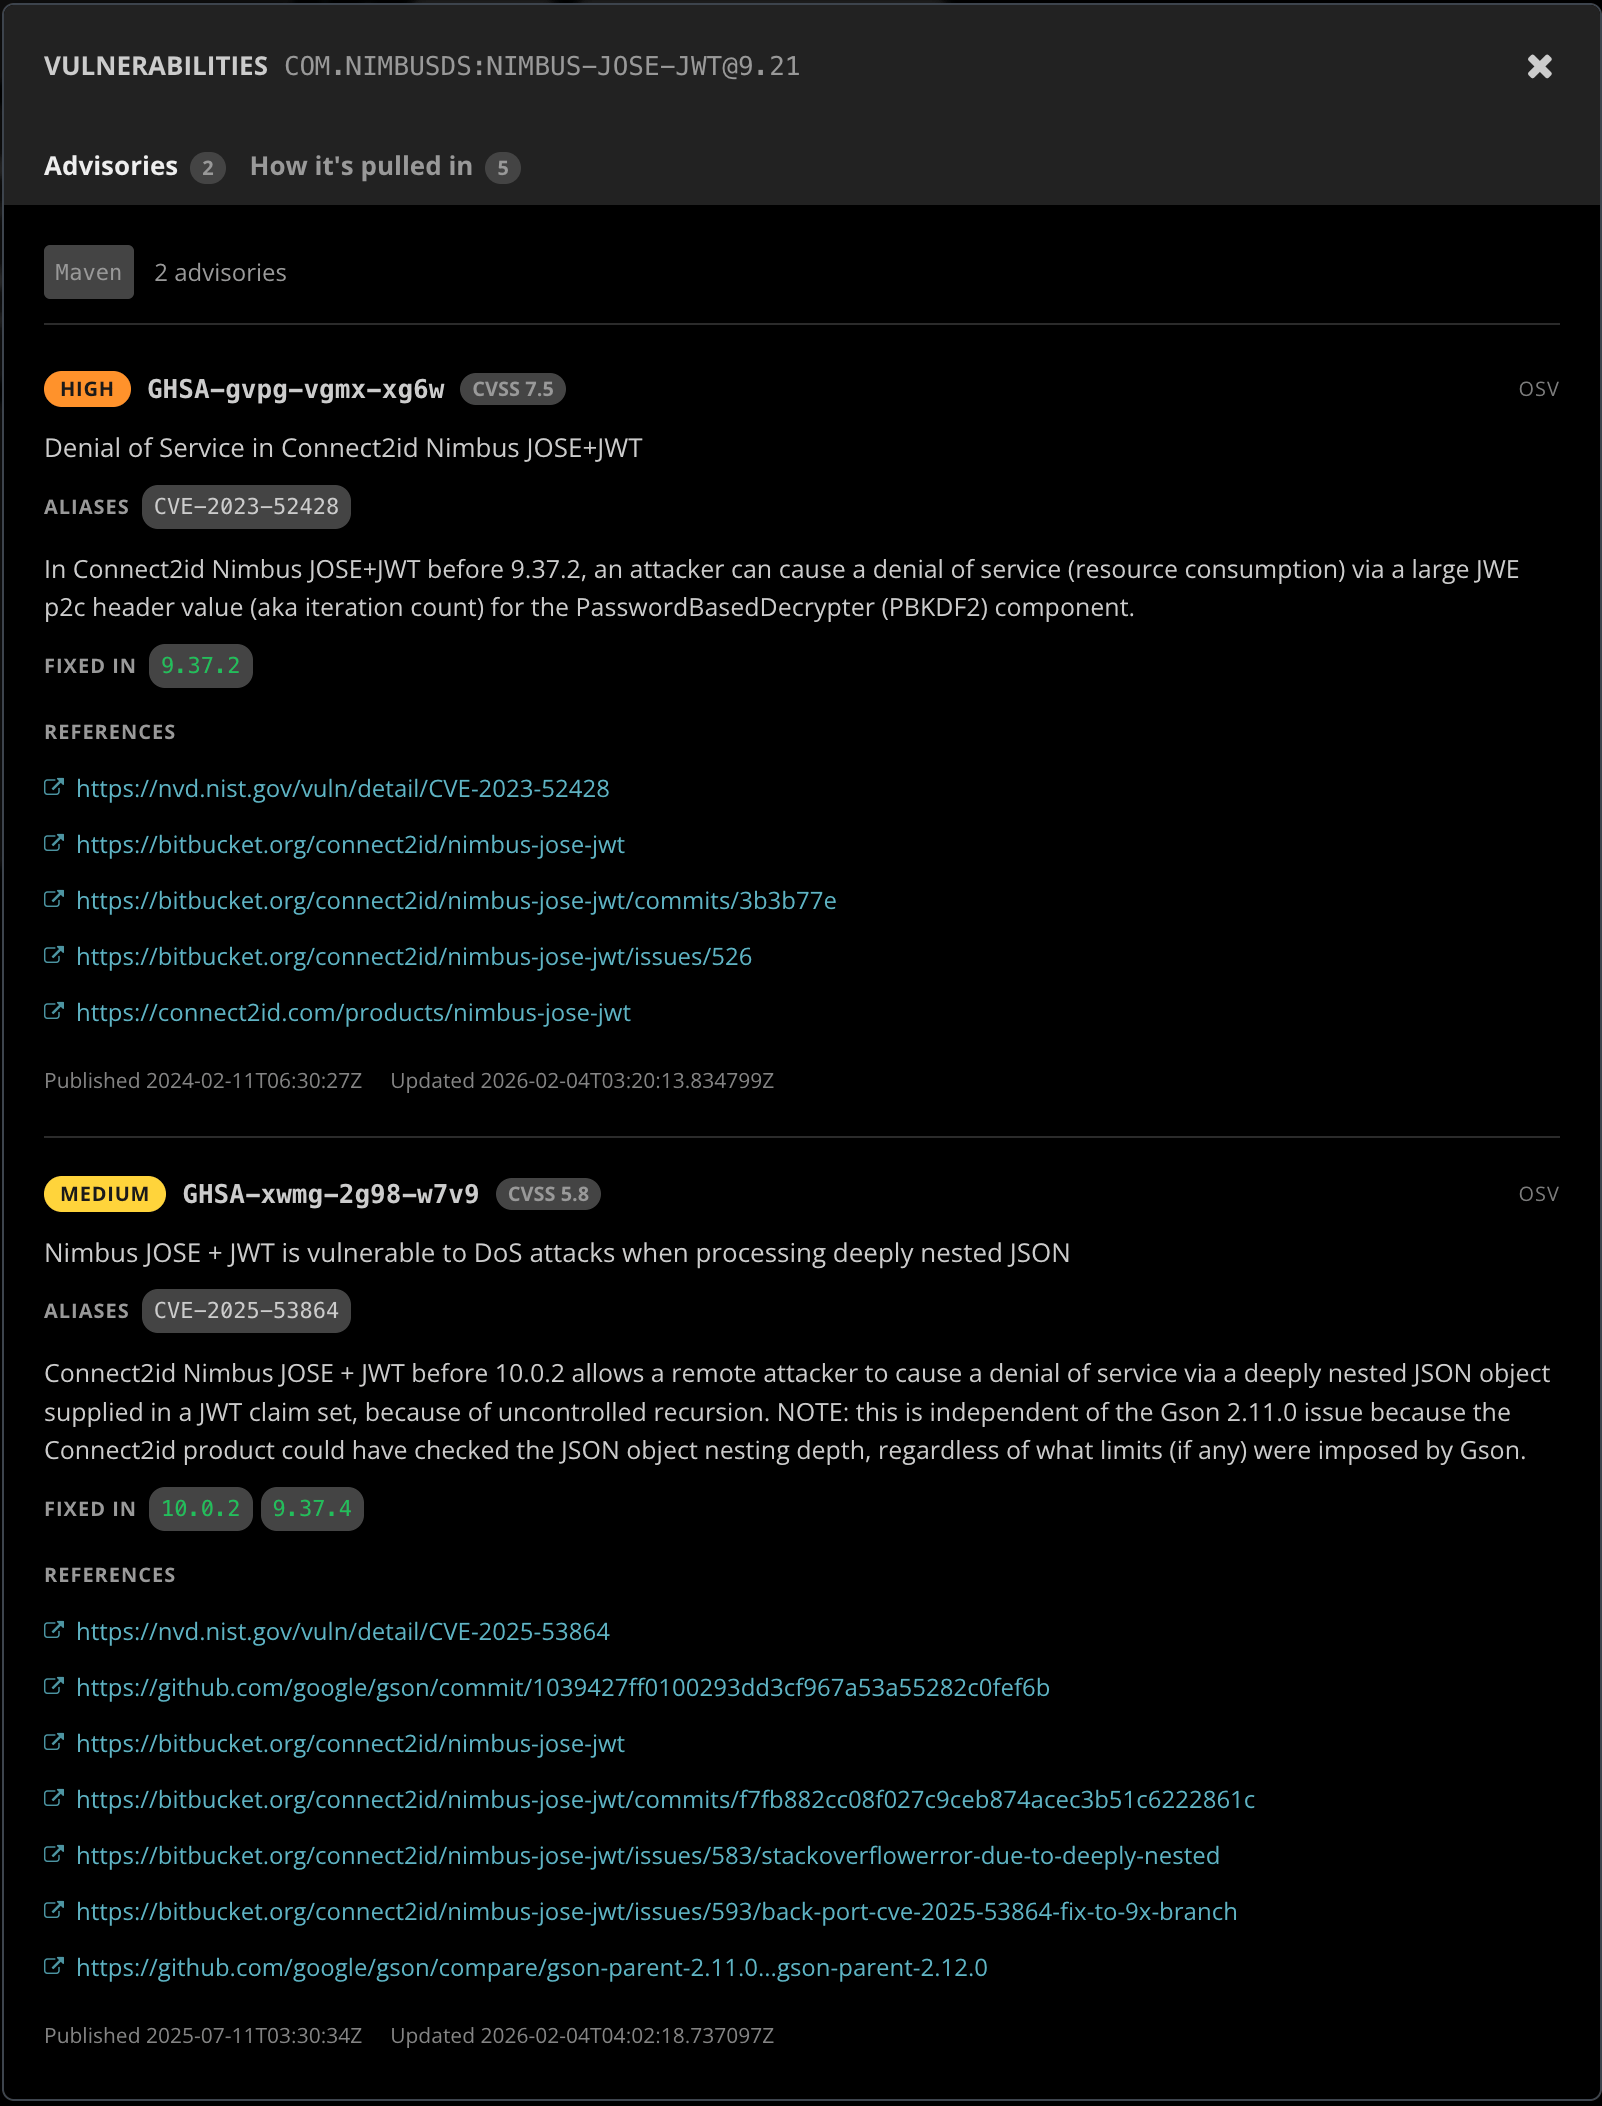
If you want the raw findings for an audit or a vulnerability-disclosure response, every scan produces a signed URL pointing to the full per-advisory detail: every affected dependency, every advisory (OSV identifier, GHSA alias, CVE number when assigned), the full upstream advisory record and its reference links. The dashboard displays the detail inline through a per-dependency dialog; the URL is also available through the public API and the MCP server for programmatic access (handy for piping into your existing security review tooling, or for a one-off “give me a CSV of every CVE in last quarter’s Releases” ask).
Putting it together
The four features — build size, build timings, dependencies, and vulnerability scanning — share one storage substrate, one dashboard, and one mental model. A Release build records its size, timings, full dependency graph, and a vulnerability summary in a single record; the dashboard renders all four on the same build page; the AI agents you’ve already given MCP access to can ask any of them in one prompt.
The dashboard arranges the build detail page around three signal tabs — Size, Timings, and Dependencies — with the vulnerability summary surfaced inline inside the Dependencies tab. A typical new-Release pass is glance at each tab, drill into whichever signal is interesting, act from there.
The same four questions are also fully wired into Bugsee’s Model Context Protocol server. The build family of MCP tools is now complete: listing builds with filters, fetching a single build with whatever heavy summaries you ask for, looking up a build by commit SHA, asking “did this build regress?” in flat form, surfacing the vulnerability summary and the new-vs-previous diff, and triggering a fresh scan. Agents with MCP access — Claude, Cursor, Copilot, Windsurf, anything else that speaks the protocol — can read every signal the build page exposes and act on it. Paired with a code assistant that has access to your source tree, the loop closes: the agent asks Bugsee what changed in the build, identifies the dependency bumps that would close the new advisories, and proposes the change against your working copy, all in one conversation.
The per-build features turn on as soon as your CI uploads a Release build with the corresponding option enabled. Existing customers get the dashboard surfaces and the new MCP tools without any additional setup; the per-build scans start landing on the next Release cut, and the periodic sweep starts catching new advisories on builds you already shipped within the first cycle.
As always, drop us a note at support@bugsee.com or reach out via chat — we love specific feedback, and we’re particularly interested in hearing about how teams want to set CI gates against the new signals.