Overview
Debugging is an important process to understand the unexpected behaviour of your application. For this reason, we must know well how to use the breakpoints to reduce the time needed to fix the bugs. Sometimes, a simple breakpoint is not enough.
In this article, I’ll explain the main advanced options and generic breakpoints available in Xcode—version 8.3.2 at the time of writing.
Advanced options
To explain the advance options, we will use a simple example, where we have an array of numbers and we count how many numbers are odd and even:
final class Iterator {
    private var oddNumbersCount = 0
    private var evenNumbersCount = 0
    init() {
        iterateArray()
    }
    func iterateArray() {
        [ 1, 2, 3, 4, 5, 6, 7, 8 ].forEach { (number) in
            if (number % 2 == 0) {
                evenNumbersCount += 1
            } else {
                oddNumbersCount += 1
            }
        }
    }
}
Then, we can add a breakpoint inside the forEach:
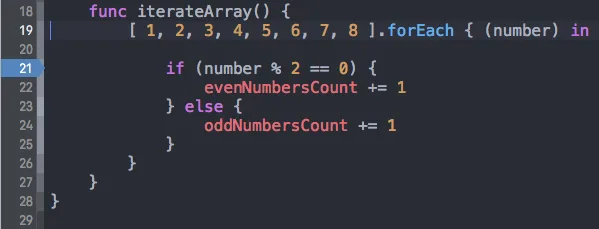
Finally, we can use the advanced options. We have two ways to do it: either right-click in the breakpoint and click Edit Breakpoint or double-click in the breakpoint.
Condition
Thanks to this option we can decide when the debugger must pause our app.
For example, we can set our breakpoint to pause if number is equal to 3:

We can add also more complex conditions, like number > 3 && number < 6.
Action
The actions are behaviour which occur every time the breakpoint satisfies their conditions.If the Condition field is empty, then the action will occur every time.
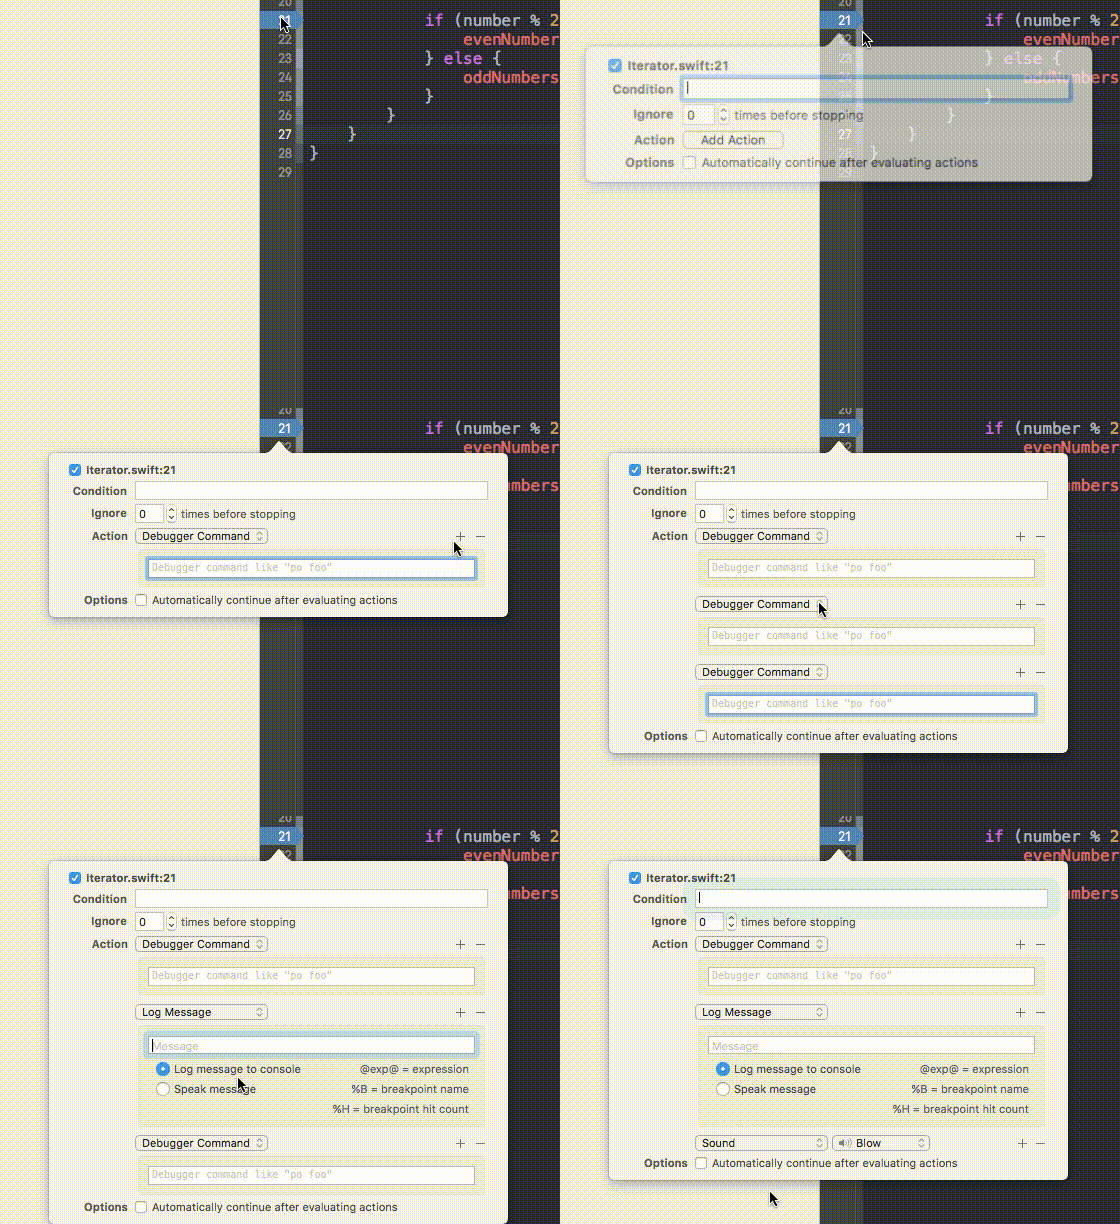
We can add a new action clicking the button Add Action under the Ignore field. Once we add a new action, we’ll have a combo box to select the action which we want to add:
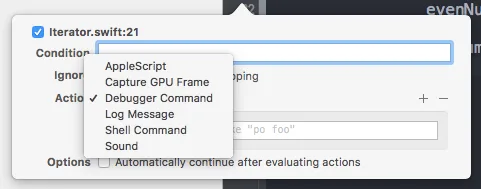
Let’s see the more common actions available:
Debugger Command
We can run a lldb command in the debug console—like po number to dump the value of number:
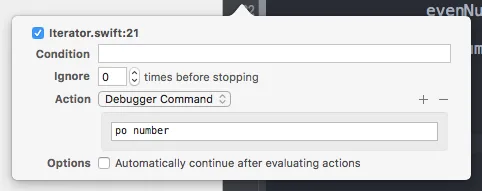
And in the console we will have something like:

You can find a list of lldb commands here.
Log Message
We can create a custom message to print in the console. If we want to dump the value of a variable we can write @variable_name@:
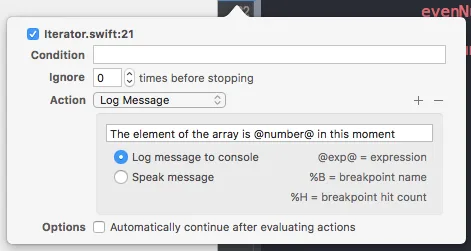
And in the console we will have something like:

Shell Command
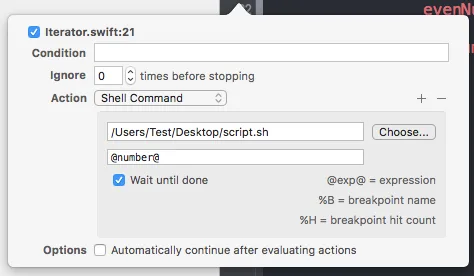
In the first field, we can add the path of our script and in the second one the arguments separated by comma. We can add a variable as argument using @variable_name@.
We can use, as example, the following script to print in the console a message:
#!/bin/bash
echo "The number is $1"
$1 is the first argument of the script.
Then, we can set the breakpoint action:
And in the console we will have something like:

You should usually turn on Wait until done to avoid errors with the script.
Sound
This action is very straightforward, it allows us to play a sound when the debugger pauses because of that breakpoint. This action provides a combo box to select different types of sound.
Combine Actions
The actions are very useful for advanced debugging and we can also add more than one:
Ignore N Times Before Stopping
Ignore allows us to skip both Condition and Action N times. We can use it when we don’t care of the breakpoint the first N times. Of course, we must use just an integer value greater than zero.
Continue After Evaluating
The last option available is Continue After Evaluating. With this option enabled, the breakpoint doesn’t pause the execution. It’s useful when combined with the actions, since we may have some actions which shouldn’t pause the app execution.
Generic Breakpoints
Xcode doesn’t provide just breakpoints to add in a specific row. You can also use some generic ones to apply to the whole project.
To activate them, we have to go inside the breakpoint navigator using the shortcut ⌘7 or using the Xcode menu View > Navigators > Show Breakpoint Navigator.
At the bottom of this view there is a + button which allows us to add several generic breakpoints:
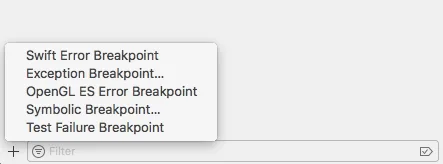
Swift Error Breakpoint
We can use this breakpoint to pause the execution when we throw an error. Let’s change a little bit the Iterator class adding an error handling if we don’t have enough odd or even numbers in our array:
enum IteratorErrors: Error {
    case notEnoughOddNumbers
    case notEnoughEvenNumbers
}
final class Iterator {
    private var oddNumbersCount = 0
    private var evenNumbersCount = 0
    init() {
        do {
            try iterateArray()
        } catch {}
    }
    func iterateArray() throws {
        [ 1, 2, 3, 4, 5, 6, 7, 8 ].forEach { (number) in
            if (number % 2 == 0) {
                evenNumbersCount += 1
            } else {
                oddNumbersCount += 1
            }
        }
        if oddNumbersCount < 100 {
            throw IteratorErrors.notEnoughOddNumbers
        }
        if evenNumbersCount < 100 {
            throw IteratorErrors.notEnoughEvenNumbers
        }
    }
}
If we activate Swift Error Breakpoint and run the app, we’ll notice that the debugger will pause in the throw:
throw IteratorErrors.notEnoughOddNumbersThis breakpoint has some advanced options like a normal breakpoint—Ignore, Action, Continue After Evaluating—and with the field Type we can decide if the debugger should pause just with a specific type of error, like IteratorErrors.
Exception Breakpoint
There are moment, in iOS development, where we have a crash and we are not able to understand what is the problem because the debugger doesn’t provide a lot of informations about it. Activating this breakpoint, the debugger will pause the execution before the crash in the row where the crash occurs.
This breakpoint is very useful to catch the crashes of our applications. We should keep it always enabled.
Since we are using Swift, we can ignore the options Exception and Break since they are more useful if we use Objective-C or C++—therefore we can leave the default values. Then, like the normal breakpoint, we have the options Action and Continue After Evaluating.
Symbolic Breakpoint
This breakpoint is very useful if we want to pause the execution when a specific method is called. To achieve it, we must add in the field Symbol the value NameClass.NameMethod. For example we can add in the field Symbol the value Iterator.iterateArray:
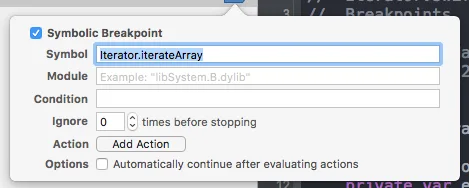
We will noticed that the debugger will pause when the method iterateArray is called.
Like with the normal breakpoint, we can add Condition, Ignore, Action and Continue After Evaluating.
Test Failure Breakpoint
I know, you are that kind of developer who writes a lot of tests. Well, this breakpoint is for you. We can enable it to pause the tests in the failing test. In this way, we can see which one is failing. Very straightforward. Moreover, like with the normal breakpoint, we can use the options Action and Continue After Evaluating.
Right-Click Options
If we right-click a generic breakpoint, we can notice that there are several options:
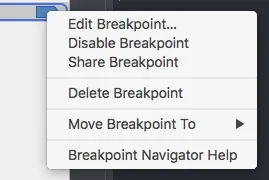
Let’s see two of them: Share and Move to.
Share Breakpoint
By default, the breakpoint remains local in your project. If we’re working in a team, the other developers are not able to use our breakpoints. Thanks to Share Breakpoint we can set the breakpoint as a global one in the project, in this way we allow also other developers to use it.
Move Breakpoint To
If we click this option, we have a submenu with two options available:
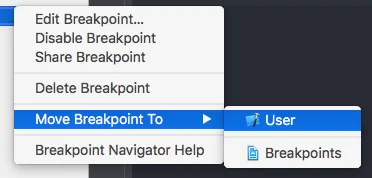
User
Moving the breakpoint to User, we will allow Xcode to add that breakpoint in all our projects. Therefore, if we move a breakpoint to User and then open a new project, we will find the same breakpoint in both projects.
A good idea is moving to User the Exception Breakpoint since it should be always enabled.
< NameProject >
The second option is the name of your current project. It’s the opposite of User. We move the breakpoint just in that specific project, therefore we cannot use the same breakpoint in all our projects but just in the current one.
Conclusion
In this article we didn’t see all the advanced option, but these are the more useful and common ones which you should use to improve your debugging skills. Of course, we don’t have to enable all of them at the same time, it may not make sense, since each bug requires a specific set of breakpoint options.
