Mobile App Performance Metrics: The KPIs That Drive Speed, Stability, and User Satisfaction

With mobile apps now the default way people shop, bank, and connect, users expect them to be fast, stable, and responsive—every time they open them. A few seconds of delay or an unexpected freeze can quickly frustrate the user and prompt them to consider a competitor. For developers and product teams, tracking and improving mobile app performance isn’t just important; it’s a direct driver of engagement, loyalty, and long-term competitive edge.
Monitoring the right performance metrics can make the difference between a mobile app users love — and the one they abandon. Every extra second of load time, unexpected crash, or clunky interaction risks losing customers and revenue. With so many factors influencing performance, knowing where to focus your attention is critical.
In this article, you’ll find:
- A clear explanation of the most important mobile app performance metrics.
- Why each metric matters for user experience and business outcomes.
- How to track them accurately using analytics and observability tools.
- Practical tips to improve your app’s speed, stability, and engagement.
Key Mobile App Performance Metrics
To get real value from performance data, you can’t just track metrics in isolation. Each one tells part of the story—but the real insight comes from understanding how they work together. For example, a fast load time means little if your crash rate is high, and a long session length might hide frustration if users are stuck navigating slow or buggy screens.
1. Load time (App startup time)
First impressions matter, and in mobile apps, this impression is set the moment a user taps your app’s icon. Load time measures how long it takes from this tap until the app is ready for interaction—including the initial rendering of the first screen and, in some cases, the loading of essential data.
Mobile teams typically track:
- Cold starts: When the app is launched from scratch, with no cached state in memory.
- Warm starts: When the app resumes from the background with some state preserved.
- Hot starts: When the app is already active in the foreground and simply needs to resume the UI; typically, the fastest startup scenario.
Why it matters
Cold starts can have the biggest impact on first impressions, as they load the app from scratch and can feel slow if not optimized. Warm and hot starts are more like resumes—users expect an almost instant return, so delays here can be especially frustrating. Tracking all three helps you catch cases where a slow resume hurts the UX (user experience).
With these distinctions in mind, you can choose the right approach for measuring and improving each type of start.
How to measure
Use analytics or performance monitoring tools that separate warm, cold, and hot starts in reporting. Measure in milliseconds (ms) from the moment the app is opened to the point when the first interactive UI element is usable. For accuracy, collect this data from real devices in production rather than relying solely on a simulator or lab tests.
Improvement tips
The goal is to get users to a usable screen as quickly as possible, whether they are opening the app for the first time or resuming it from the background:
- Minimize initialization code and load non-critical components after the first screen is displayed.
- Optimize network calls at startup by batching requests or caching responses.
- Use lazy loading to defer loading of heavy assets until they are needed.
2. Crash rate
Crashes aren’t just a nuisance—they directly impact retention and revenue. Even brief crashes can frustrate users, interrupt tasks, and erode trust in your brand. According to a 2024 peer-reviewed study in the International Journal of Mobile Computing and Application, mobile apps with crash rates above 1% see an average 26% decrease in 30-day user retention.
By tracking crash rate alongside affected user segments and sessions, you can prioritize fixes that will have the biggest impact on stability and keep more users engaged.
Why it matters
Every crash disrupts the user journey and risks losing that user for good. High crash rates damage reviews, app store rankings, and word-of-mouth reputation. Even infrequent crashes can be costly if they occur during high-value actions like checkout or account creation.
How to measure
Most mobile analytics platforms report crash rates as:
(Number of crashed sessions / Total sessions) x 100
Track crash-free users as well. This shows the percentage of your audience who never experienced a crash within a given period. For deeper insight, segment crash data by OS version, device model, app version, and network conditions. Always use real-world production data to ensure accuracy.
Improvement tips
When tackling stability issues, start with the fixes that will make the biggest difference to users and business impact. The aim is to remove the most disruptive failures first so that user trust can be restored quickly.
- Prioritize fixing crashes that block core user flows or affect large user segments.
- Use crash reporting tools (like Bugsee) that capture stack traces, device context, and session replays.
- Test under real-world conditions, including poor network connections and older devices.
- Deploy hotfixes quickly for widespread or high-impact crashes.

3. Time to Interactive (TTI)
Time to Interactive (TTI) measures how long it takes from the moment a screen begins loading to when it becomes fully interactive—meaning all key elements are displayed, data is loaded, and the user can tap, scroll, or type without delay. It’s a broader measure than load time because it focuses on the point at which the app is truly usable, not just visible.
Mobile teams often track TTI for specific high-impact screens, for example, the home feed, checkout page, or search results, since performance can vary widely depending on data sources and complexity.
Why it matters
A screen that appears quickly but can’t be used yet creates a frustrating “false start.” Users may tap repeatedly, thinking the app is frozen, or abandon the session altogether. Tracking TTI shows you how long users really wait before they can act, helping you pinpoint bottlenecks—whether they’re in rendering, API calls, or device processing.
Google’s Lighthouse categorizes TTI performance as:
- Under 3.8 seconds: Fast — Green
- 3.9 – 7.3 seconds: Needs improvement — Orange
- Over 7.3 seconds: Slow — Red
How to measure
To get accurate, actionable TTI data, you’ll need tools and methods that reflect real-world usage, not just lab conditions.
- Use mobile performance monitoring tools that can capture both rendering milestones (first paint, first render) and interaction readiness.
- Measure in milliseconds from the start of screen creation to when input responsiveness is confirmed.
- Collect data from real devices in production, segmented by device type, OS version, and network conditions.
Improvement tips
Your goal is to shorten the gap between first render and full usability so users can act as soon as the screen is visible.
- Preload or cache critical data before the screen opens.
- Optimize API calls—parallelize requests when possible, and reduce dependency on slow endpoints.
- Render the visible UI first and load below-the-fold or secondary elements asynchronously.
- Minimize heavy main-thread operations during initial screen setup.
4. Rendering performance (Frame rendering time / Freeze time)
Smooth scrolling, fluid animations, and instant visual updates are signs of a well-optimized app. Rendering performance measures how efficiently your app draws frames on a screen. At 60 frames per second (fps), each frame has about 16 milliseconds to render —exceed this and frames are dropped or “skipped”, causing visible stutter.
A related concept is Freeze time — the total time the UI spends blocked by slow frames (e.g., 100 ms, 300 ms, or more). Longer or frequent freezes make interactions feel laggy, even if load times are good.
Why it matters
Even small drops in rendering smoothness can make an app feel unresponsive, especially during scrolling or animations. This erodes user trust and can increase abandonment rates, particularly on content-heavy screens like feeds or maps. Tracking both average frame time and freeze time helps you pinpoint whether the issue is an occasional glitch or a persistent performance bottleneck.
How to measure
Use mobile performance monitoring tools or platform-specific APIs (such as Android’s FrameMetrics API or iOS’s Core Animation Instruments) to capture frame durations. Focus on:
- Average frame render time: How long it takes to draw a typical frame.
- Freeze time: Cumulative time spent rendering slow frames (>16 ms).
- Freeze count: Number of frames exceeding the 16 ms threshold.
Measure on real devices under realistic network and CPU/GPU load conditions. Segment results by device model, OS version, and app version to identify environment-specific issues.
Before fixing, confirm whether slow frames come from main-thread work (layout recalculations, heavy drawing) or external bottlenecks (large network payloads delaying UI updates).
Improvement tips
Once know the source of rendering slowdowns, focus on reducing main-thread load and improving frame pacing:
- Offload heavy work from the main/UI thread to background threads.
- Use pagination or view recycling for long lists to avoid rendering all items at once.
- Optimize images, vector assets, and animations to reduce draw complexity.
- Profile regularly after feature changes to catch regressions early.
5. App retention rate
Retention rate measures the percentage of users who return to your app after a specific period (commonly Day 1, Day 7, and Day 30 after installation). It’s one of the clearest indicators of whether your app is delivering ongoing value that keeps users coming back.
Strong retention signals that your app is consistently meeting user needs. Declining retention can point to friction in the UX, unmet expectations, or loss of interest. Retaining existing users is far more cost-efficient than acquiring new ones; therefore, focusing on retention is critical to improve profitability and long-term growth.
Why it matters
Losing users soon after acquisition quickly erodes your investment in marketing and onboarding. High retention often correlates with higher lifetime value (LTV) and stronger word-of-mouth growth, as satisfied users are more likely to recommend your app. Tracking retention helps teams identify drop-off points in the user journey and prioritize fixes that extend their lifecycle.
How to measure
To measure retention consistently:
- Define your retention window (e.g., 1 day, 7 days, 30 days after first install).
- Calculate:
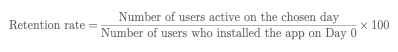
- Segment results by device type, OS version, acquisition channel, or app version to identify patterns.
- Track trends over time to see if changes improve or harm retention.
2024-2025 Retention benchmarks
Percentage of users who return to the app after installation.
| App Category | Day 1 Retention | Day 7 Retention | Day 30 Retention | Sources |
| All Categories | ~26% | ~13% | ~7% | adjust.com |
| Finance Apps | ~27% | ~18.5% | ~8% | onesignal.com; amraandelma.com |
| Productivity Apps | ~33% | ~24% | ~9.6% | nudgenow.com |
If your app’s retention rates are below the category norms, investigate onboarding, app performance, and feature relevance.
Improvement tips
Improving retention comes from identifying and resolving the reasons users disengage:
- Improve onboarding to help users reach the “aha” moment quickly.
- Use push notifications or in-app messages to re-engage inactive users.
- Continuously update content or features to keep the app fresh.
- Personalize the experience based on user behavior and preferences.
6. Session length
Session length measures the amount of time a user spends actively engaged with your app in a single visit, from the moment they open it until they close it or it times out after a period of inactivity. Longer sessions can indicate high engagement, while shorter ones may signal usability issues, poor content relevance, or performance problems.
Many teams also track average session length over time and segment it by device, type, OS version, acquisition channel, or user cohort. This helps uncover patterns, such as whether new users drop off faster than loyal ones, or if certain devices have consistently shorter sessions.
Why it matters
Session length is a window into user engagement quality. Sustained engagement usually indicates users find enough value in your app to stay longer and return more often. Conversely, declining session length (especially when paired with other negative metrics like rising churn or falling retention) can indicate navigation friction, performance bottlenecks, frustrating UI flows, or content that fails to capture interest.
How to measure
Track the time between session start (app open or resume from background) and session end (close, crash, or inactivity timeout). For accurate results:
- Ensure your analytics or observability tool resets session timers correctly when the app is backgrounded and resumed.
- Segment data by user type, acquisition source, and device/OS for deeper insight.
- Combine with session frequency data to see whether shorter sessions are offset by more frequent use.
Improvement tips
Before making changes to boost session length, determine whether longer sessions align with your product’s goals—some apps, like utilities, benefit from short, efficient interactions. Once you’ve confirmed it’s a priority:
- Streamline navigation so users can easily discover and move between features effortlessly.
- Remove friction points that trigger early exits, such as long load times or confusing CTAs.
- Personalize content or recommendations to keep users exploring.
- Improve stability—unexpected crashes can abruptly cut sessions short and frustrate users.
Best Practices for Mobile App Performance
Performance issues are rarely caused by a single factor; they are often the result of multiple small inefficiencies compounding over time. Applying proven best practices across design, development, and monitoring helps you prevent many of these issues before they affect users.
- Prioritize the user experience in every release: Don’t let feature velocity outpace performance considerations. Test each reimpacts startup time, responsiveness, and stability before shipping. A feature that slows the app by even a second can undo gains in user engagement.
- Minimize network dependencies: Reduce the number and size of API calls and other network requests your app makes, especially during startup and key user flows. Techniques like batching requests, enabling HTTP/2, and using caching can significantly cut load times and reduce the impact of poor network conditions.
- Optimize media and asset handling: Large images, videos, and animations can rapidly (and dramatically) slow down an app. Use compression, adaptive image sizing, and lazy loading to deliver rich media without compromising responsiveness.
- Protect battery life and device resources: Monitor CPU, GPU, and memory usage to prevent battery drain and overheating. Optimize background processes and remove unnecessary polling or updates.
- Monitor continuously with observability tools like Bugsee: Real-time visibility into metrics such as crash rate, load time, and retention helps you detect regressions early. Use these insights to guide targeted optimizations and validate fixes.
Following these best practices alongside the metrics we’ve covered will help you maintain a balance between feature growth and performance, ensuring your app stays fast, stable, and engaging over time.
Conclusion
In mobile apps, performance isn’t a luxury; it’s a core part of the product experience. A fraction of a second in load time, a single crash, or a sluggish interaction can make the difference between a loyal user and an uninstall. By tracking the right metrics—startup time, crash rate, responsiveness, retention, and session length—you can spot problems long before they escalate and make informed decisions about where to focus your optimization efforts.
But metrics alone aren’t enough. Continuous monitoring, real-world testing, and a culture that values performance as highly as new features are key to keeping an app competitive in 2025’s crowded marketplaces.
This is where observability tools like Bugsee add real value. By capturing detailed performance data, crash reports, and session replays from real users in production, you get the context needed to quickly trace issues back to their root cause and confirm they’re fixed.
Mobile performance is never “done.” The best teams make it an ongoing process—measuring, learning, and improving with every release to deliver the fast, reliable experiences users expect. Start with the metrics in this guide, keep your eye on the benchmarks, and make performance part of your DNA.